On paper, the key event rate looks pretty straightforward: it’s the percentage of sessions or users that convert. However, because of the way GA4 calculates it, how incomplete data collection may be, and other nuances, that neat percentage rarely represents the complete picture.
If you’d like the key event rate to really help you compare performance in different channels and spot conversion trends, you have to grasp how the metric actually works, what its problems are, and what other dimensions you should look at alongside it. Shall we?
What is key event rate in GA4?
Also known as conversion rate, key event rate is GA4’s way of measuring conversion performance. It tells you what percentage of your traffic completes actions you’ve marked as important to your business – purchases, form submissions, sign-ups, etc.
GA4 gives you two versions of this metric:
-
Session key event rate
The percentage of sessions where at least one key event happened. If you have 100 sessions and 25 of them included a purchase, that’s a 25% session key event rate.
-
User key event rate
The percentage of users who triggered a key event at least once, regardless of how many times they visited. If 30 out of 100 users eventually converted (even if it took them multiple sessions), that’s a 30% user key event rate.
The math problem behind this
At first glance, the formulas of both metrics look straightforward:
- Session key event rate = (Number of sessions with a key event ÷ Total sessions) × 100
- User key event rate = (Number of users with a key event ÷ Active users) × 100
But here’s where calculations get complex: let’s say you have a user who visits your website three times. In the first session, they browse and don’t convert. In the second session, they make a purchase. In the third session, they come back to check the order status, so don’t convert. What this means is:
- From a session perspective: 3 sessions total, 1 session with a key event = 33% session key event rate for this user.
- From a user perspective: 1 user total, 1 user with a key event = 100% user key event rate for this user.
Now scale this logic across your entire audience. In other words, session key event rate punishes successful conversions when people return without converting again, while user key event rate rewards you once someone converts, regardless of how many times they come back afterward.
Neither is right or wrong, they simply answer different questions. Session key event rate counts sessions with key events, not total key events. As for the user key event rate, it doesn’t actually use “Total users” in its calculation like you’d expect – instead it uses “Active users”, so people who had an engaged session.
This creates a disconnect between what you see in your reports and what the key event rate actually represents. You can’t manually calculate it by dividing your key event count by sessions or users, because the numbers won’t match.
From a business perspective, this makes sense for some scenarios: if your goal is to get someone to sign up for your newsletter, you only care about getting them once, not whether they accidentally submitted the form twice. But for e-commerce, when someone makes five purchases, those are five distinct business outcomes and collapsing them into one converted session obscures real performance.
Why does key event data feel incomplete?
Even when calculations work as intended, you’re probably not seeing the full picture if you only look at key event data without interpreting other metrics and without considering external constraints, such as:
-
Cookie consent is blocking a huge chunk of your tracking. Every visitor who declines cookies in your consent banner becomes invisible to GA4. In regions with strict privacy laws, you could be missing 30-40% of your actual conversions.
-
Ad blockers and privacy settings filter out even more. Browser extensions, private browsing modes, and built-in tracking prevention all prevent GA4 from recording sessions. Your actual traffic is higher than what GA4 shows, you just can’t see it.
-
Thresholding hides data to protect user privacy. When GA4 detects that showing certain data might identify individual users, it hides it. You’ll see a “(not set)” label or reduced numbers in your reports, not because there’s no data, but because GA4 won’t show it to you.
-
Processing delays can take 24-48 hours. GA4 doesn’t update in real-time, so what you see today might not reflect conversions that happened yesterday, especially for high-traffic websites or complex tracking setups.
-
The numbers don’t match between platforms. The key event rate you’re looking at in GA4 only represents a subset of reality. If you try comparing your GA4 key event rate with Google Ads conversion data, for example, you’ll see different numbers and both platforms will insist they’re correct. Well, they are, but they’re measuring different things – as we see in greater depth in these articles: “Linking GA4 with Google Ads: setup, alternatives and best practices” and “Key Events vs. Conversions in GA4”.
It’s important to get this straight: you can’t fix incomplete data collection, since that’s the reality of privacy-first analytics, but what you can control is making sure the data you have is analyzed correctly. That starts with understanding metric scopes.
"Conversion rate is completely devoid of meaning until you actually inject some meaning into the tool that produces this metric."
– Simo Ahava, Google Developer Expert for Google Analytics and Google Tag Manager
Mixing metrics and scopes: the mistake you need to avoid
There is a trap that catches even experienced analysts: combining metrics from different scopes in the same report. In short, GA4 operates on three scopes: user, session, and event. Each one measures behavior at a different level. When you mix them, you get numbers that technically load in a report but tell you nothing useful.
For example: imagine you’re analyzing “Total Users” (user-scope) next to “Session Duration” (session-scope). One metric aggregates behavior across someone’s entire history with your website, while the other looks at individual visits. Putting them side-by-side produces a comparison that doesn’t actually compare anything meaningful.
The same issue impacts key event rate. If you’re looking at session key event rate alongside user-scoped dimensions, or vice versa, your report is mathematically correct but analytically useless. The numbers will be off and you won’t know why until you realize you’re comparing apples to oranges.
How to get scope matching right
The key is understanding that every dimension – either built-in or custom – has a scope. So, when building reports for your key event rate analysis, use this as a reference:
-
Session key event rate goes with session-scoped dimensions like:
- Session source/medium
- Landing page
- Session campaign
- Session Google Ads campaign
- Any event-scoped custom dimension that fires per session
-
User key event rate pairs with user-scoped dimensions like:
- First user source / medium
- First user campaign
- Acquisition date
- User ID (if you’re tracking logged-in users)
- Any user-scoped custom dimension
These are GA4 built-in dimensions. When you need to create custom dimensions, the same principle applies – you have to choose a scope (event, user, or item for e-commerce), which determines which metrics the dimension can pair with in your reports. To create custom dimensions in GA4, all you have to do is:
-
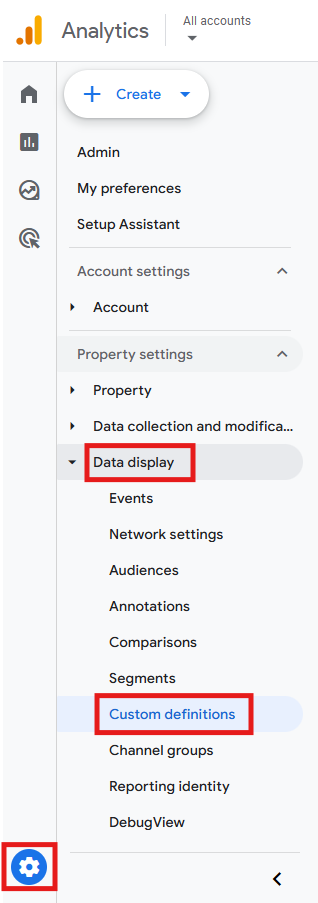
Go to Admin > Data display > Custom definitions.
-
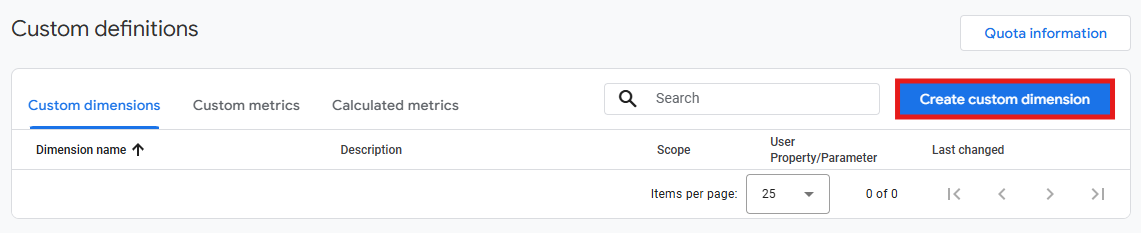
Click Create custom dimension.
-
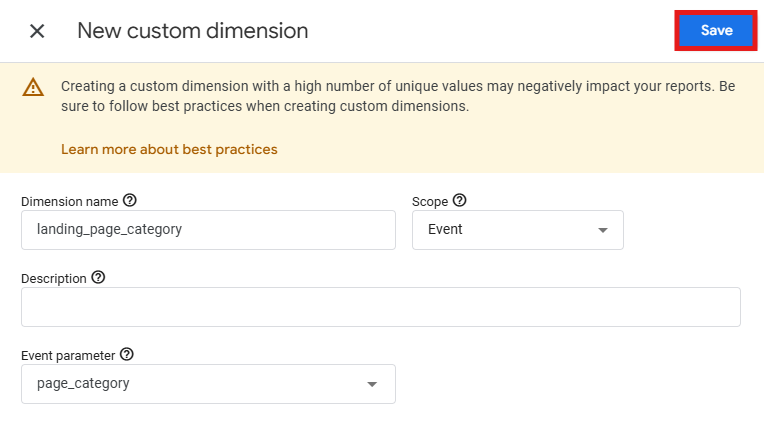
Set a Dimension name (e.g., landing_page_category), a Scope (e.g., Event) and an Event parameter (e.g., page_category). Then Save.
To help you understand scope matching before we move on, let’s say you want to understand key event rates by traffic source:
-
For session analysis, use “Session source / medium” with “Session key event rate”. This shows you which channels drive the highest conversion rate per visit. You might discover, for example, that paid search converts at 8% per session.
-
For user analysis, use “First user source / medium” with “User key event rate”. This shows you which channels bring in users who eventually convert. You might see, for example, that organic search users convert at 25% eventually, even though their first-session conversion rate was only 3%.
Keep in mind: creating a custom dimension in GA4 is only half the process. To actually populate it with data, you’ll need to configure your tracking in Google Tag Manager (GTM) to send the right parameters or set user properties. This typically involves creating variables and modifying your Google Tag, but you can learn how to do that in greater detail in the article “How Google Tag Manager fits into the GA4 setup”.
How to access the key event rate in GA4
Now that you understand how the metric works and which dimensions to pair it with, let’s see where to find it in GA4. There are two options for this: standard reports and Explorations.
1) Finding key event rate data in standard reports
The easiest place to start is the standard acquisition reports, where Google has built key event rate directly into the interface.
For session key event rate:
-
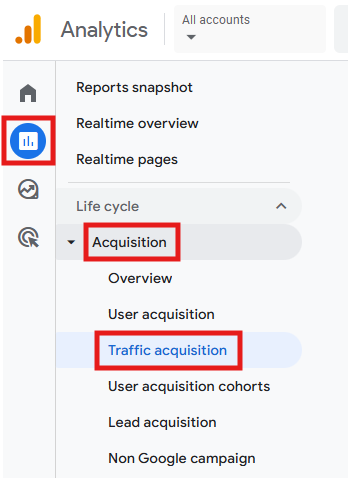
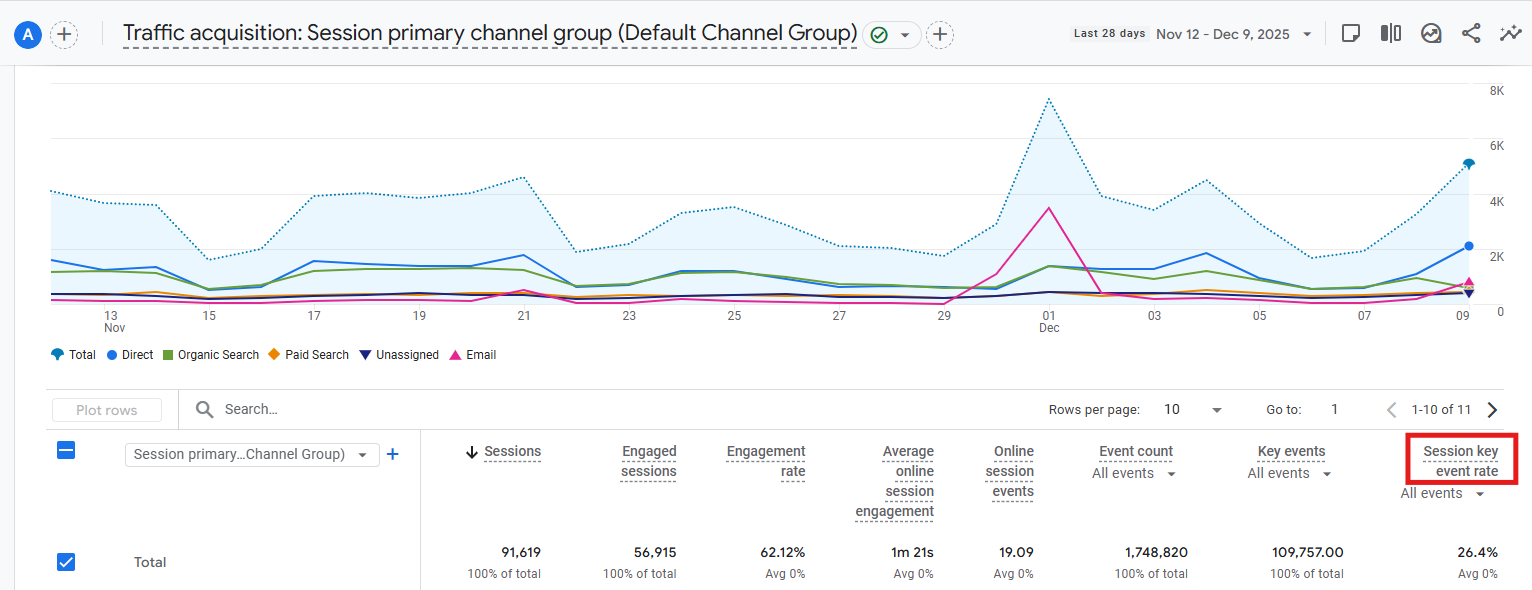
Go to Reports > Acquisition > Traffic acquisition.
-
In the table below the graphic, scroll right and you’ll see Session key event rate as one of the default columns – it’s showing you the key event rate for each traffic source.
-
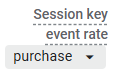
If you wish to see the rate for a specific event instead of all key events combined, click the dropdown at the top of the column (which, by default, says “All events”) and select the event you want to analyze (e.g., purchase).
For user key event rate:
-
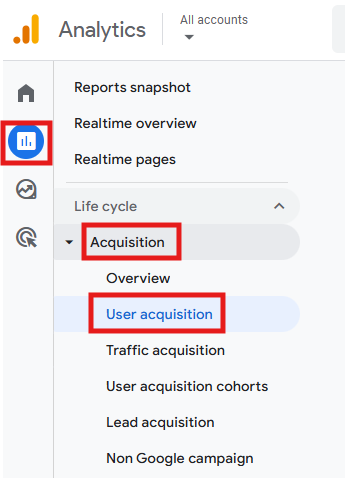
Go to Reports > Acquisition > User acquisition.
-
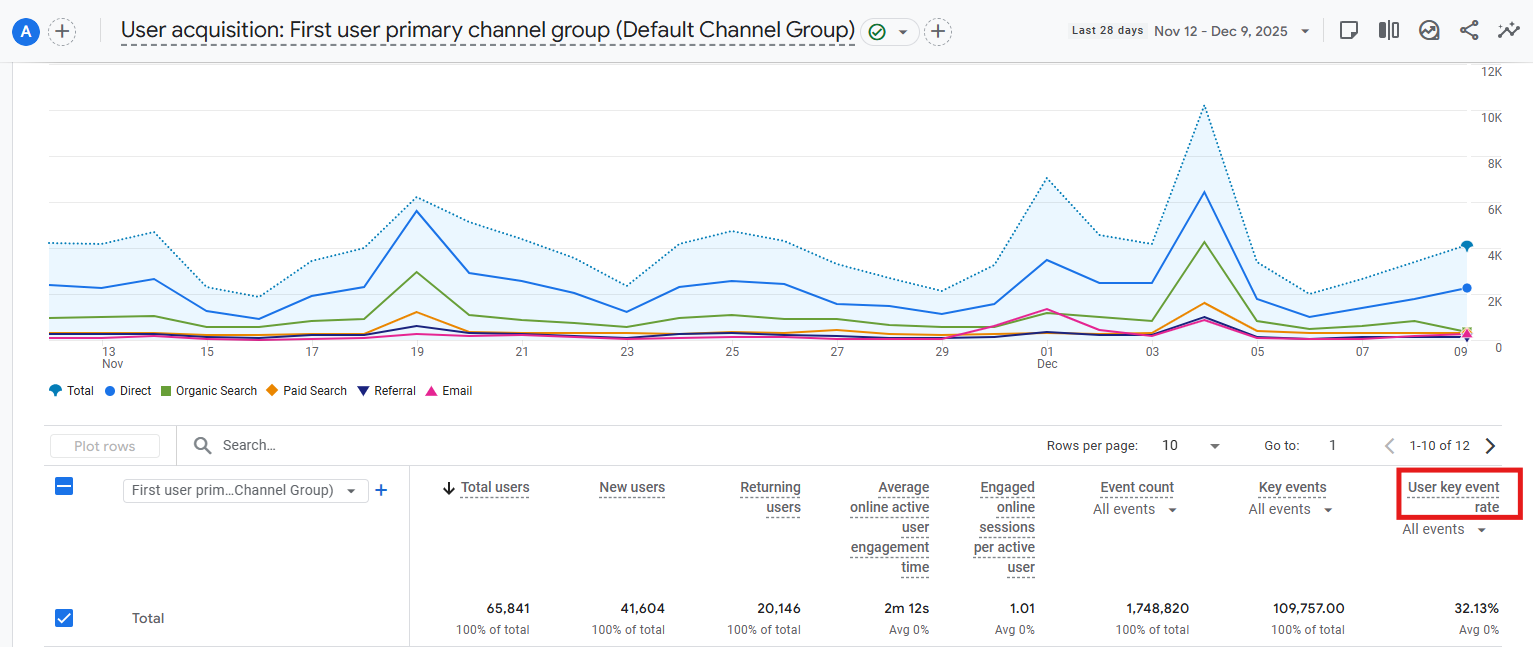
In the table below the graphic, scroll right and you’ll see User key event rate as a default column. Same process as session rate, but now you’re looking at user-level conversion instead of session-level.
2) Creating custom reports with key event rate
If you want to customize dimensions, add filters, or dig deeper into your data, you’ll need GA4’s Explorations feature.
Setting up a session key event rate exploration:
-
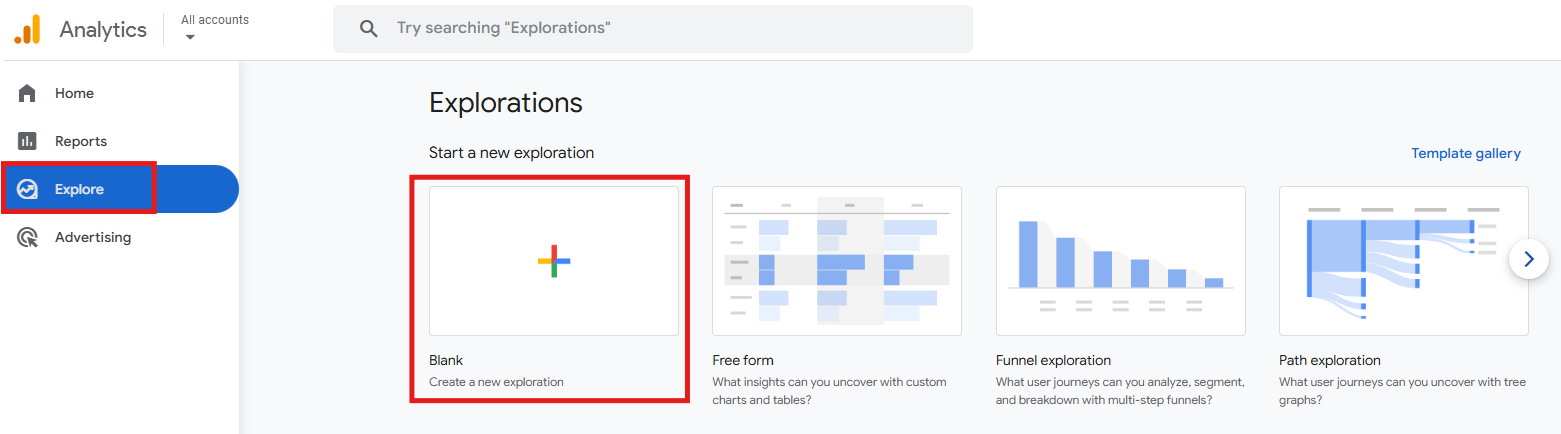
Go to Explore > Click Blank.
-
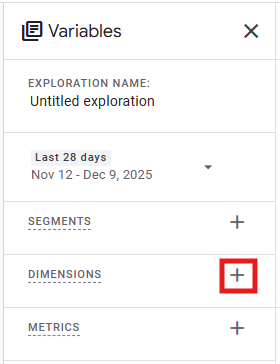
In the Variables panel on the left, click the + icon next to Dimensions.
-
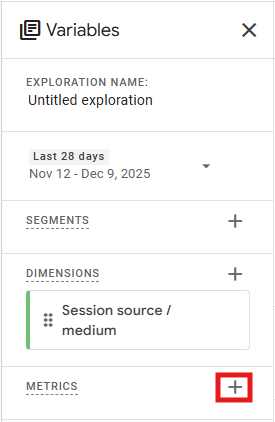
Search for and select Session source / medium (or any other session-scoped dimension you want to analyze). Click Confirm.

-
Now click the + icon next to Metrics.
-
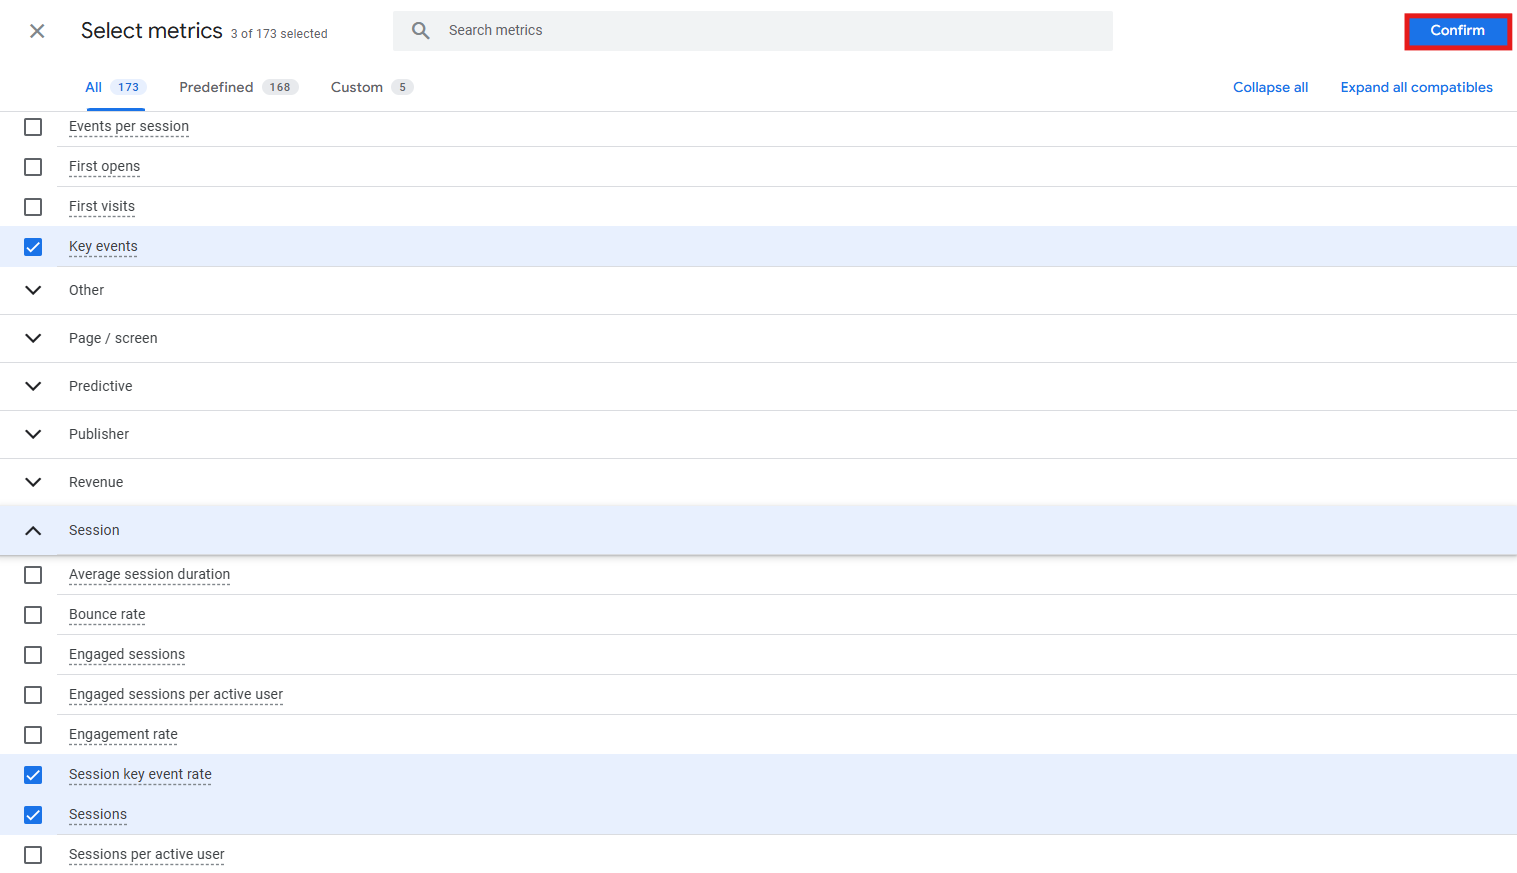
Search for and select Sessions, Key events, and Session key event rate. Click Confirm.
-
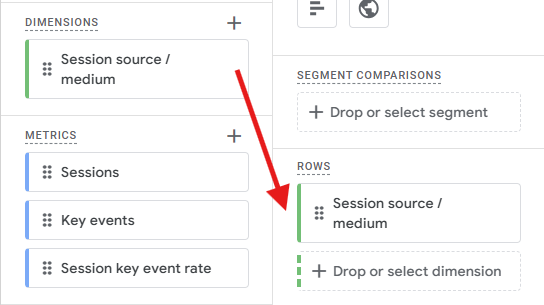
Drag the dimension Session source / medium into the Rows section on the right.
-
Drag your three metrics into the Values section.
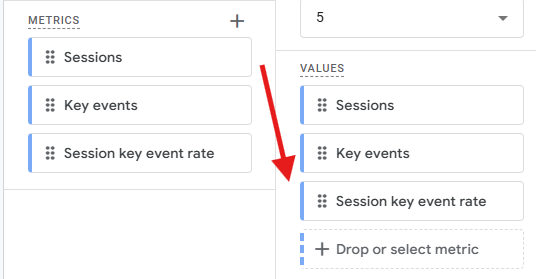
You’ll now see a table showing the key event rate broken down by traffic source. But there’s a catch: unlike standard reports, Explorations calculate key event rate across all your key events combined. So, if you’ve marked purchase, sign_up, and generate_lead as key events, the rate includes all three. You can’t just select one from a dropdown like you can in standard reports.
To filter for a specific event, you need to do this:
-
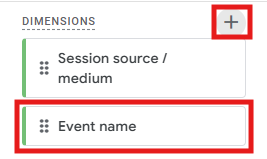
In your custom report, add Event name as a dimension.
-
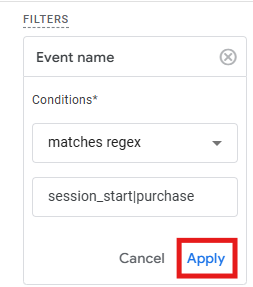
Find the Filters section on the right and add a filter with the following conditions: Event name > matches regex > session_start|purchase. Click Apply. This filter tells GA4 to include all sessions (via session_start) but only count purchase as the key event. Replace purchase with whatever event you want to analyze.
Setting up a user key event rate exploration:
The process is nearly identical, but you’ll use user-scoped dimensions instead:
-
Go to Explore > Blank.
-
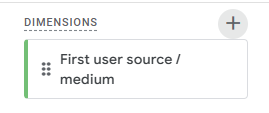
Add a user-scoped dimension like First user source / medium.
-
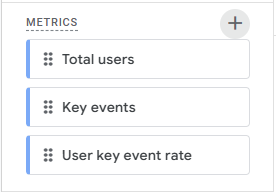
Add these metrics: Total users, Key events, and User key event rate.
-
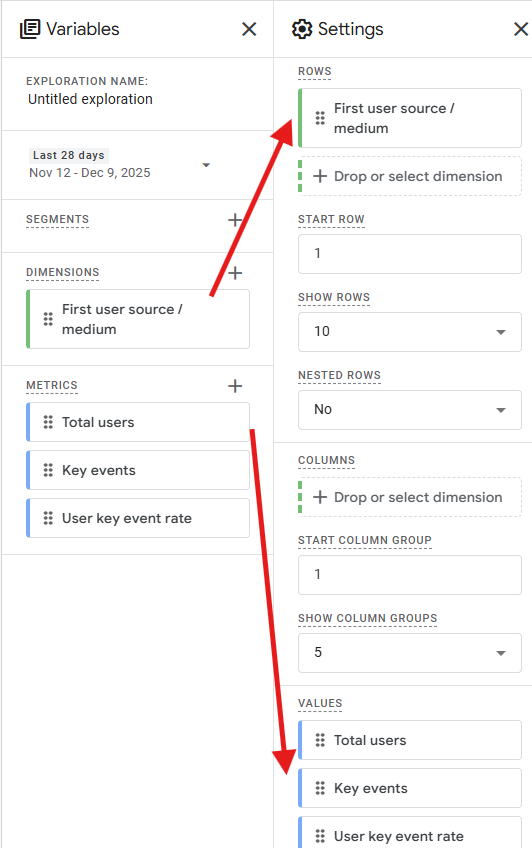
Drag the dimension to Rows and metrics to Values.
-
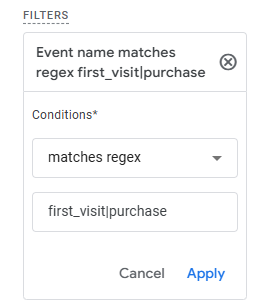
The same filtering limitation applies. To analyze a specific key event, add Event name as a dimension and add a filter with the following conditions: Event name > matches regex > first_visit|purchase. Replace “first_visit” with whatever user-scoped event makes sense for your analysis, or keep it as is.
How to actually get meaning from key event data
Does all this mean the key event rate is useless? Not at all. It just means you need to start using it as one signal among many. Here’s how you should be looking at it:
-
Make sure you’re measuring what actually matters
A high key event rate doesn’t automatically mean success, and a low rate doesn’t necessarily mean failure. First, ask yourself questions like: which events did you mark? Are they actually valuable? Did you accidentally mark page_view as a key event and inflate results? The metric only matters if you’ve defined it thoughtfully.
-
Compare trends instead of absolute numbers
If your key event rate increased from 3% to 4% month-over-month, that change matters, even if the absolute numbers are incomplete. Keep your focus on patterns like this.
-
Segment your data
Don’t look at the overall key event rate in isolation. Break it down by channel, device, campaign, or landing page. A 2% rate from paid search might be excellent, while 2% from email could signal a problem.
-
Use calculated metrics when you need them
As an example, key event rate counts sessions with purchases, not individual purchases – if someone buys three items in one session, that’s still just one converted session. So, for e-commerce, you might want the traditional conversion rate: total purchases ÷ total sessions. Create this as a calculated metric in Looker Studio or query it in BigQuery.
-
Cross-reference with other platforms
Your backend knows how many orders actually happened. Your payment processor knows transaction counts. So, use both as sanity checks. If GA4 shows a 5% variance from your backend, that’s normal, but if it shows 30%, investigate.
-
Document what you’re measuring
When you report on key event rate, specify which events you’re including, which scope you’re using, and what limitations exist in the data. For example, you could write down something like: “Our GA4 session key event rate for purchases is 4%, but this excludes users who declined cookie consent and may differ from backend order counts by 10-15%”.
A quick summary
Since there was a lot of ground covered, here’s a summary of the key differences between session key event rate and user key event rate:
| Session key event rate | User key event rate | |
|---|---|---|
| What it measures | Percentage of visits that resulted in a conversion | Percentage of people who converted at least once |
| Formula | (Number of sessions with a key event ÷ Total sessions) x 100 | (Number of users with a key event ÷ Active users) x 100 |
| When to use it | Campaign performance, landing page effectiveness, and immediate session outcomes | Long-term conversion potential, audience quality, multi-touch journeys |
| What happens with repeat conversions | Multiple key events in one session = still just one converted session | Multiple key events across sessions = still just one converted user |
| What happens with repeat visits | Return visits without conversion lower the rate | Return visits without conversion don’t affect the rate |
| Typical use case | ”Is this paid search campaign converting well per click?" | "What percentage of our audience eventually completes at least one key action?” |
| Pairs well with… | Session-scoped dimensions (session source/medium, landing page) | User-scoped dimensions (first user source, acquisition date) |
| Where to find it | Traffic Acquisition report (Reports > Acquisition > Traffic acquisition) | User Acquisition report (Reports > Acquisition > User acquisition) |
| Common mistake | Thinking you can divide total key events by sessions to calculate it (the numbers won’t match) | Assuming it uses “Total users” in the denominator (when it actually uses “Active users”) |
| Usually higher or lower? | Lower (because return visits dilute it) | Higher (because it ignores non-converting return visits) |
Final thoughts
GA4’s key event rate has real value for understanding trends and comparing performance across channels, but it should not be treated as the absolute truth. To get the best insights from imperfect or incomplete data – which is always a given in digital analytics – you need to look at key event rate as simply an indicator among many: combine it with other metrics, understand its limitations, and cross-reference with other data.